Clicky

E-mini Executors

Sunday, November 27, 2011

The market has been unraveling...


The market has been unraveling.  Ever since the S&P crossed back below their 150 day smooth moving average the market has been in a downward spiral.  The bears are back in control of this trade.  The S&P, Dow, Nasdaq, and Transports are all trading below their major moving averages and in negative territory for the year.  All of the Indices are also trading in the middle of this summers’ range which puts the bottom of that range in play (the lows of the year).  As long as the markets remain in this summer’s range I think that the lows of the year are in play.  

I talk about this all of the time; when the news and the technicals collide we have a battle….when the news and the technicals coincide we have the biggest moves.  Europe has obviously weighed on the U.S. markets.  Where the U.S. markets are priced right now “technically” gives the bears complete control of this trade.   Right now the market tells me that we could be in store for a big move lower due to the negative headlines and the breakdown in technicals.  If the news starts to get better and we see a rally; the key will be if we can crossover the major moving averages and sustain trade above them.  In the past six months we have not seen that happen and until it does I think that all of the rallies will be met by big sellers.

This week will be a very interesting week for the market.  If the market rallies then I think that we could see some bulls step in and try to give the market a little push higher possibly trying to retest some major moving averages (which I think will be met with strong sellers).  If we continue to selloff then I think that we could see some panic selling come in and we may have another bad week for stocks.  The bears have all of the momentum with the headlines and technicals going their way.  That means I will be more aggressive selling rallies (barring any good news from Europe) and very nimble when buying breaks.  Have a great week!


Moving Averages; Black (10 day), Blue (20 day)Green (50 day)Pink (200 day) Purple (150 day smooth avg.).  Horizontal Lines; Blue (High of the year)Red (Low of the year)Green (Unchanged for the year, Black (last summers range), Light Blue (Old highs that could be tested)

$SPX

$ES_F


$SPY

$DJIA

$DJT

$NQ_F

$VIX

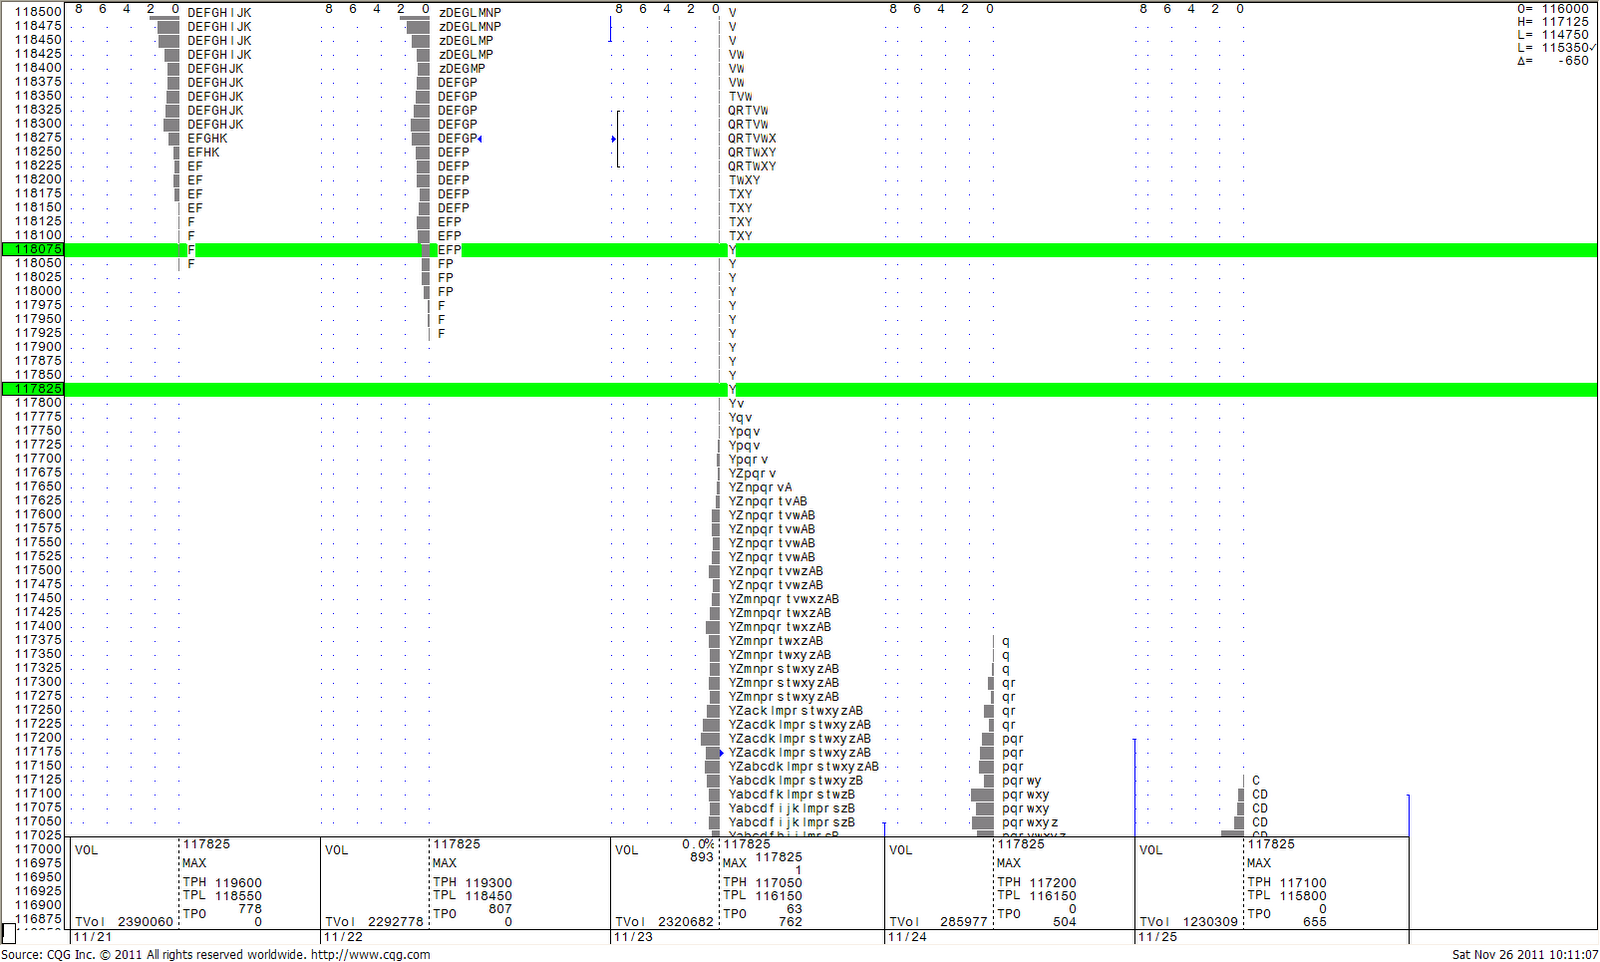
Market Profile single ticks


Market Profile daily single ticks

Market Profile daily single ticks

Market Profile daily single ticks


Sunday, November 20, 2011

The bears continue to battle with the bulls.

The bears continue to battle with the bulls.  Last week was a good week for the bears.  The headlines about Europe continue to pressure the longs and we are now starting to see technical damage being done.  Up until last week the bulls were looking pretty good despite the negative headlines.  Now we are seeing the technicals start to break down and they could soon be looking to favor the bears.

The Nasdaq 100 futures which had been trading above their 200 day and 50 day moving average for over a month.  They now have had two consecutive days with closes below both moving averages (bearish action).  The Nasdaq has been the leader to the upside and when the leader starts to have bearish action that is not good for the rest of the market.  As long as the Nasdaq remains below their 200 day and 50 day moving averages I think that we will continue to see selling pressure on the market.

The Dow has been chopping around its 200 day moving average for weeks and as of right now they are trading below it.  The Dow still remains above the rest of their major moving averages and is still in positive territory for the year (11,577).  If the Dow cannot get back above their 200 day moving average within the next day or so I think that the market will take that as a negative and we could see the Dow slip lower looking to retest some of their major moving averages and unchanged for the year.

The S&P (cash, futures, SPY) are now trading in between their 150 day smooth moving average and their 50 day moving average.  With the momentum now being to the downside; they need to get back above their 150 day smooth moving averages sooner than later or I think that the 50 day moving averages will be tested.  If the 50 day moving averages are broken then I think that the market will see a sharp selloff.  If they can hold their 50 day moving averages then I think that we could see the market firm up and work its way higher.

The Transports have been the weakest market over the past several months and on this recent break there was no real technical damage done.  Last week they tested and held their150 day smooth moving average. If the Transports can sustain trade above their 150 day smooth moving average then we may see equities start to work their way back up.  If they cannot hold their 150 day smooth moving average then I think that we could see the market continue to selloff.

With all that is going on with Europe I will be watching the technicals extremely close.  When the headlines and the technicals collide we see a battle, but when they start to work together we see the biggest moves.  

CHARTS
Moving Averages; Black (10 day), Blue (20 day)Green (50 day)Pink (200 day) Purple (150 day smooth avg.).  Horizontal Lines; Blue (High of the year)Red (Low of the year)Green (Unchanged for the year, Black (last summers range), Light Blue (Old highs that could be tested)


$SPX


$SPY

$DJIA


$NQ_F

$VIX


Sunday, November 13, 2011

Thoughts on the current market and the week ahead... 11/14 - 11/18

Last week's battle was won by the bulls but the war has yet to be determined.  The headlines remain in favor of the bears but the technicals are in favor of the bulls.  That is what is creating this war.  At some point in the near future I think that we could see a sharp move in one direction.  As of right now I am thinking that move will be higher.  For all of the bad news that we have seen in the past month(s) the market is not in bad shape.   

The Nasdaq (100 futures) remain the strongest market by sustaining trade above their 200 day moving average and at the top part of their yearly range.  If the Nasdaq can get above their weekly high at 2408.75 I think that they will make new highs of the year rather quickly (2435.50).  

The Dow is also remaining strong.  On Friday the Dow closed back above their 200 day moving average and they are now about 720 points away from their high of the year.  

This week the S&P (futures, cash, SPY) all held an important test of their 150 day smooth moving average. They all basically had a double bottom at their 150 day smooth moving averages and now are comfortably above it.  Although that is bullish action I am still not convinced the bulls are in control of the S&P.  The S&P (futures, cash, SPY) are all in positive territory for the year (just barely) and they all look like they want to test their 200 day moving averages and daily down trends.  If they can close above their 200 day moving averages and daily down trends then I thinks that the bulls will have control.  

The Transports are still the weak link in the chain but they are showing signs of strength.  They too (like the S&P) held a test of their 150 day smooth moving average and as of right now they are at their daily down trend and 200 day moving average.  If they can close above that area the only thing left for them to accomplish would be getting back into positive territory for the year.  If that happens then I think that bulls will have complete control over the market and we could see a nice rally.  

If the headlines about Europe's debt crisis can turn positive (not sure if that is possible) I think that the market could be set up for a nice year end rally.  If the headlines get worse I will be watching to see if the technicals break down for the bulls.  If that happens then I think that we could sell off into the end of the year.  If nothing happens and its the same old headlines, then I think that we go higher.

CHARTS
Moving Averages; Black (10 day), Blue (20 day)Green (50 day)Pink (200 day) Purple (150 day smooth avg.).  Horizontal Lines; Blue (High of the year)Red (Low of the year)Green (Unchanged for the year, Black (last summers range), Light Blue (Old highs that could be tested)

$DJIA

$SPX

$DJT

$NQ_F

$VIX

$SPY

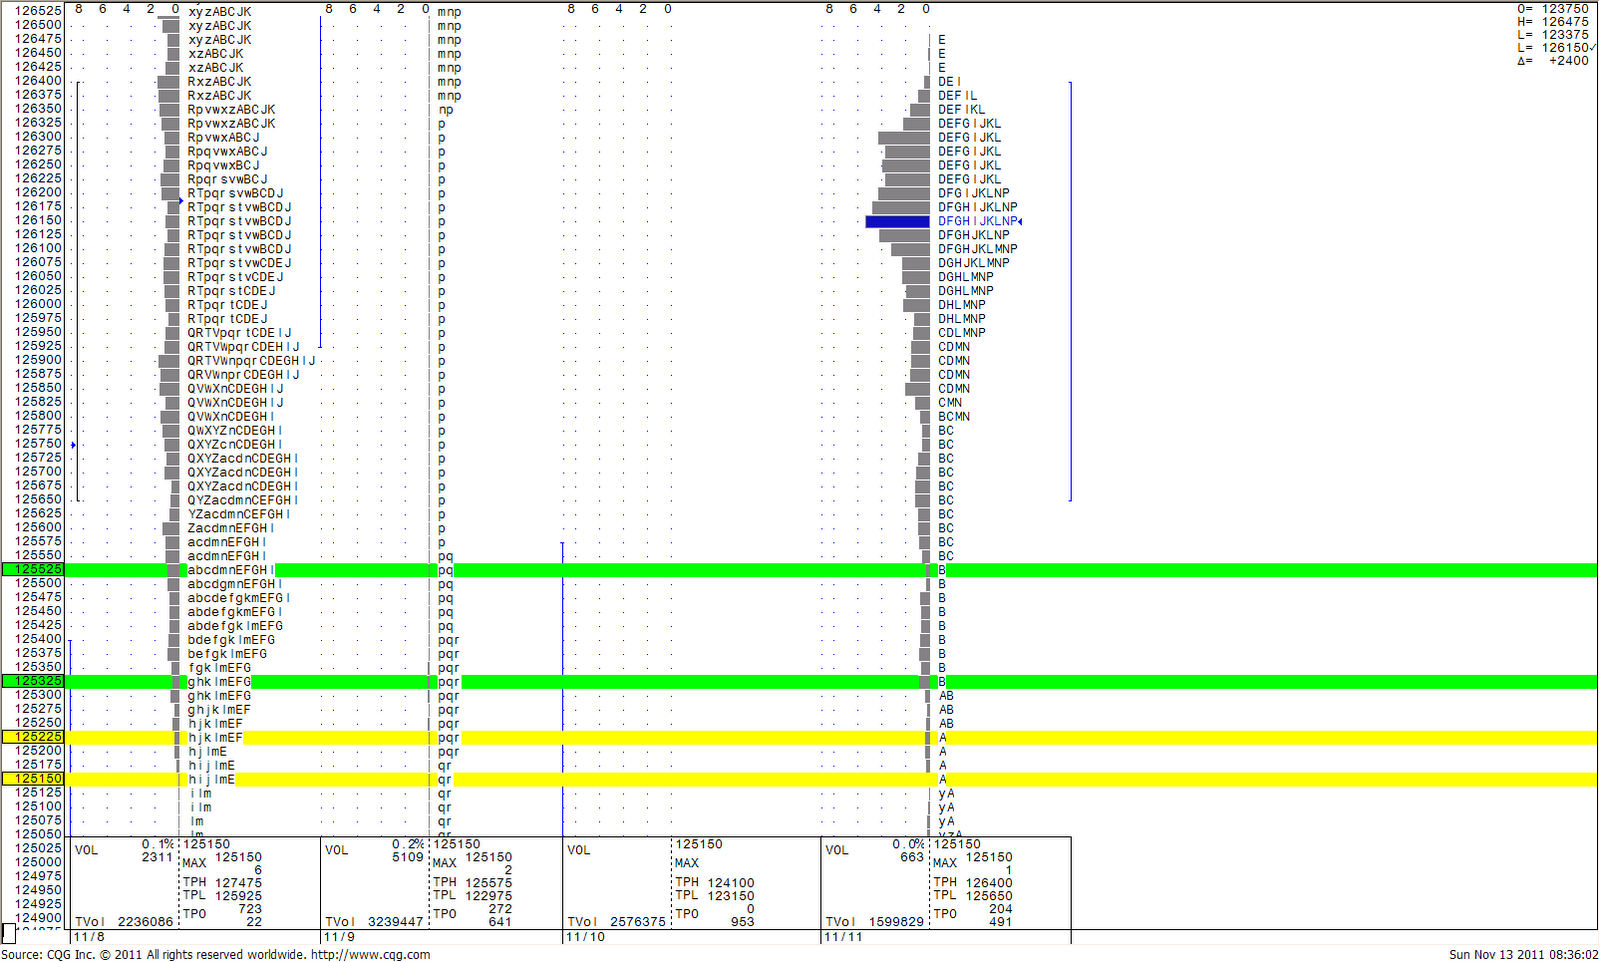
Market Profile single ticks from Friday's trade.  $ES_F


Sunday, November 6, 2011

November Newsletter

November Newsletter 2011


Saturday, October 29, 2011

Thoughts on the current market and the week ahead. 10/31 - 11/04

What a week for the bulls.  They accomplished pretty much everything that they wanted to.  The Dow is trading comfortably above their 200 day moving average and is in positive territory for the year by 650 points (not to mention they violated their August high), the Nasdaq futures remain the strongest market and are getting within striking distance of their yearly highs ($NQ_F hi-2435.50), the S&P cash took out their daily down trend and closed above their 200 day moving average for two consecutive days (that is great news for the bulls), the VIX is trading well below 30.00 (the bulls have been waiting for that to finally happen), and the only weak link that I can see (technically) are the Transports.  The Transports are struggling to hold above their 200 day moving average and they are the only major Index that remains in negative territory for the year.  

In order for this rally to continue I think that the Transports have to hold above their 200 day moving at 5,022 and eventually work their way into positive territory for the year (5,106).  If they cannot, then I think that we will see the rest of the market soften and start to work its way lower retesting support areas.  I think that the Transports are crucial because they were the leader on the way down and I think that in order for the market to continue its run higher they need the weakest link (Transports) to turn strong.

This week I will be focusing on the Transports and how the rest of the market reacts to what they are doing. If the Transports remain below their 200 day moving average at 5,022 I will be more inclined to sell rallies in the S&P.  If the Transports can hold above their 200 day moving average, then I will be a buyer of breaks and be looking for the S&P cash to test their August high at 1307.38 and the E-mini futures to test their August high at 1309.75.  I expect some resistance at the August highs but if the Transports are in positive territory for the year (5,106), I will be a cautious seller of the S&P.  If the S&P gets above their August high then I think that we could see another pop in equities across the board.


Moving Averages; Black (10 day), Blue (20 day)Green (50 day)Pink (200 day) Purple (150 day smooth avg.).  Horizontal Lines; Blue (High of the year)Red (Low of the year)Green (Unchanged for the year, Black (last summers range), Light Blue (Old highs that could be tested)


$SPX

$ES_F

$SPY

$DJIA

$DJT

$NQ_F

$VIX

Sunday, October 23, 2011

The week ahead 10/24 - 10/28

The bulls are in full control of this trade.  The Transports are back above their 150 day smooth moving average, the S&P has broken out of its two month range and is also trading back above their 150 day smooth moving average, the Dow is comfortably back in positive territory for the year, and the Nasdaq continues to rally sustaining trade above all of their major moving averages.   The only thorn in the side of the bulls is the VIX.  If the VIX continues to hold above 30.00 that may stall this rally.

For the past several months news has been the main driver in this market.  It has been about Dodd Frank, downgrades of U.S. debt, debt ceiling, the Eurozone debt crisis, etc......   Now the market seems to be looking past the news and focusing more on the technicals.  

I have seen the market trade like this before......bad news forces everybody to think that the market will remain weak and traders think that we are range bound.  This keeps everybody away from buying stocks. The next thing you know we are rallying to new highs and nobody is in (riding the wall of worry).  I am not sure that we are going to make new highs but I do think that the trend could remain bullish into the end of the year.

What I will be looking for this week.....

As long as the Transports and the S&P cash remain above their 150 day smooth moving averages I will be a buyer of breaks and looking for the market to trend higher.  The main area of resistance that I will be looking for is unchanged in the S&P (1157.64) and above that I will be looking for a test of the 200 day moving average at 1274.70.  If the Transports or the S&P cash cannot hold their 150 day smooth moving averages I will turn seller (leaning on the 150 day smooth moving averages) looking for the market to sell off down to my support levels. For my day to day thoughts on the market check out my Morning Brief.  Have a great week.

S&P Cash

Dow Industrials

E-mini Nasdaq 

Dow Transports

VIX

Moving Averages; Black (10 day), Blue (20 day)Green (50 day)Pink (200 day) Purple (150 day smooth avg.).  Horizontal Lines; Blue (High of the year)Red (Low of the year)Green (Unchanged for the year, Black (last summers range), Light Blue (Old highs that could be tested)

Monday, October 17, 2011

Daily Newsletter

Here is today's newsletter that is sent to subscribers every morning before the U.S. markets open.

Morning Brief 10-17

Sunday, October 16, 2011

The week ahead 10/17 - 10/21

The bulls are on the verge of taking complete control of this trade.  The Nasdaq has gotten itself comfortably above all of their major moving averages and it looks like they want to make new highs for the year.  The Dow closed back in positive territory for the year and that is giving the market confidence.  The Transports broke their daily down trend and they are now looking to test some of their important moving averages.  The S&P cash is trading right on their 150 day smooth moving average and they are testing the top of this recent range.

The market seems to have taken the debt crisis in Europe and put it on the back burner.  Even though the market is rallying, it feels like there has been little participation in this rally.  I think that traders are scared to buy into this rally and I also think that a lot of traders are thinking that a continuation of this rally would be unlikely.  It feels like a lot of traders missed their chance to buy the market near the lows and nobody wants to chase it higher (we are now riding the wall of worry). I think the lows are in for the year and we will see hedge funds and money managers chase performance into the end of the year.  

What could change my mind......

Worse news coming out of Europe or another major event (news can change anything but I think that the worst is behind us for this year).

I think that the Transports will be the key to this rally.  If they can sustain trade above their 50 day moving average then I think that we will see new highs in the Nasdaq, Dow and possibly the S&P.  If the Transports fail to hold their 50 day moving average then I think that the lows for the year are back in play.

This week I will be keeping a close eye on the Transports.  If they continue to grind higher and test resistance I will remain a buyer of breaks in the S&P.  If the Transports start to slip then I think that will create some doubt for the bulls and we could see the market sell off and retest some major moving averages.      (see charts below)

For my day to day thoughts sign up for a free 7 day trial of the morning brief.  Have a great week.

Moving Averages; Black (10 day), Blue (20 day)Green (50 day)Pink (200 day) Purple (150 day smooth avg.).  Horizontal Lines; Blue (High of the year)Red (Low of the year)Green (Unchanged for the year, Black (last summers range), Light Blue (Old highs that could be tested)

$DJT

$DJIA

$NQ_F

$SPX

$ES_F

$VIX


Saturday, October 8, 2011

The week ahead 10/10 - 10/14

Do we have a bottom?

I wrote in my Morning Brief on Wednesday that I saw some signs that the bottom was in.  The first sign was that the VIX could not make new highs for the year.  This is significant because they basically have a double top over the past two years (48.00 this years high; 48.11 last years high).  Failure to take out that double top was bullish action for the stock market.

The Transports came within striking distance of last years low (3,872) and then quickly turned higher.  The Transports went from leading us lower to leading us higher.  The Nasdaq failed to take out a low from August (2022.25) that the charts were showing could be a breaking point for the Nasdaq.  The Dow Industrials were inside last summer’s range and started to look ugly and then they took off to the upside closing back above that range (10,808). All of this action is bullish but we are not out of the woods yet.

This week I will be focusing in on the Nasdaq.  Even though the Transports are the leader of this market the Nasdaq is currently at a more critical area.  I think that in order for the market to sustain this rally the Nasdaq has to sustain trade above their 150 day smooth moving average (2181.63).  If they cannot then  I think that we could drift back down and possibly test the recent lows. We may chop around the 150 day smooth moving average, but it is important that they do not spend too much time below it.

I will also be watching the S&P cash; I want to see if they can get back above their 50 day moving average (1177.87) and their daily down trend at 1177.01.  If they can get back above this area then I think that we could see a nice pop in equities across the board.  If they cannot get back above this area then I think that we will sell off.

For my day to day thoughts sign up for a free 7 day trial of the morning brief.  Have a great week.

Moving Averages; Black (10 day), Blue (20 day)Green (50 day)Pink (200 day) Purple (150 day smooth avg.).  Horizontal Lines; Blue (High of the year)Red (Low of the year)Green (Unchanged for the year, Black (last summers range)

$NQ_F

$DJT

$SPX

$VIX

Tuesday, October 4, 2011

Morning Brief

To view today's Morning Brief please click on the link below to download the pdf file.

Morning Brief

An explanation on how to use the Morning Brief....


Monday, October 3, 2011

October Newsletter 2011

October Newsletter 2011

Sunday, October 2, 2011

The week ahead 10/03 - 10/07.

Last week could have been the week the bulls wished never happened.....The strong Nasdaq is now turning weak; they broke their daily uptrend and now closed back below their 150 day smooth moving average.  The S&P, Dow Industrials, and Dow Transports cannot sustain trade above their measly 10 and 20 day moving averages and are getting awfully close to their lows of the year.  That is bearish action and the bears seem to be in full control of this trade.

I am looking at last summers range when me made the lows for the year.  I think that last summer's range is important; if the market cannot sustain trade above that range then it becomes a good possibility that they test the bottom of that range.  

On Friday the S&P cash closed almost dead on the top of last summer's range (1131.23 was the top of the range and they closed at 1131.42).  The Dow Industrials and Nasdaq futures are still trading above theirs, while the Dow Transports (our downside leader) are trading near the bottom of last summer's range (getting close to last years lows).

When the Transports remain weak the rest of the market seems to drift lower (even the Nasdaq).  With a bearish Dow Theory Confirmation and a recent break down in technicals in the Nasdaq the market still seems to be searching for a bottom.

See charts for more thoughts on the week ahead......

Moving Averages; Black (10 day), Blue (20 day)Green (50 day)Pink (200 day) Purple (150 day smooth avg.).  Horizontal Lines; Blue (High of the year)Red (Low of the year)Green (Unchanged for the year, Black (last summers range)


$SPX

$NQ_F

$DJIA

$DJT


Tuesday, September 27, 2011

One day bullish the next day bearish....

One day the market looks bearish and the next day it looks bullish.  Back and forth we go...where well end up nobody knows.  That old saying has more meaning now than it has in years.  This is actually a day traders dream.  The more confusion the better!  Confusion creates volatility and I love volatility.

I have been either talking or writing about this divergence between the major markets for months now and I am still not convinced which way the market is headed.

Can the Nasdaq lead us higher when the rest of the market remains weak?  I don't think they can.

Can the Transports continue to lead us lower with a strong Nasdaq?  I don't think that they can.

The market loves a leader but if the leader does not actually lead the rest of the markets in their direction; the leader will then end up a follower. That is why I think that we are seeing such high volatility.  When the technicals in the Nasdaq start to break down we see a collapse across the board.  When the Transports start to firm up we have huge up days.

The tug of war is between the Transports and the Nasdaq.

Historically when we have a weak Transports and Dow the rest of the market also remains weak.  The current Dow Theory confirmation is that the trend is bearish.  That would suggest that the rest of the market would be weak (everybody is except the Nasdaq).

Historically if we have a strong Nasdaq the rest of the market also rallies.  The Nasdaq is currently trading above most of their major moving averages and they are in an uptrend (but the rest of the market is not).

Although I am not a complete Dow Theorist I respect it because I have seen it work many times in the past.  I have also seen the Nasdaq lead the market.  With the split picture that we are seeing I am just identifying which one is working that day.  If the Nasdaq is strong and the Transports look firm; then I am more aggressive when I am buying breaks.  If the Transports are weak and the Nasdaq is failing to hold support then I am more aggressive when I am selling rallies.  If one is weak while the other is strong you have to be a scalper.

Eventually we will see the market make up its mind but until then I think that the big swings are imminent.


www.eminiexecutors.com 239-594-6876 info@eminiexecutors.com

Wednesday, September 21, 2011

Divergence between ES and NQ and how day traders can take advantage of it.

The S&P is acting like they want to re-test the lows of the year while the Nasdaq is acting like they want to make new highs. 

How can you take advantage of this if you are a day trader?

I key in on the Nasdaq because they are more dominant in their direction.  If the Nasdaq remains strong (by sustaining trade above their 200 day m.a.) then I am more aggressive when I am buying the S&P.  If the Nasdaq is below their 200 day m.a. then I am more aggressive with my selling (until the Nasdaq gets to their next area of support).

An aware trader sees that the Nasdaq is stronger than the S&P and applies that knowledge to their execution.

I know to be a cautious seller of the S&P when the Nasdaq is making intraday highs.  Also notice if the S&P continues to make intraday lows and the Nasdaq does not; I am then ready to cover my shorts or possibly reverse and get long. If the Nasdaq starts to fail at support then I am more aggressive with my selling in the S&P because they are already weak and a weak Nasdaq will only add grease to the fire.

Something else to remember about the upside leader of the market; they usually go through resistance with ease and a lot of times they come up short of support. 

This is how I adapt to the conditions of the market.  Remember that every strategy is supposed to create a return on your investment but the executor of that strategy has the ability to greatly increase that return.  Be patient and watch what is going on in other markets when you are executing your strategy.

Talking futures on FOMC day.


www.eminiexecutors.com 239-594-6876 info@eminiexecutors.com

Futures Talk today at 1:30 ET


Live video from your Android device on Ustream

Login below or tag your tweet with #eminix to join the conversation.


Sunday, September 18, 2011

The week ahead 9/19 - 9/23

The market is on a teeter totter.  One week it looks good for the bulls and the next week it looks good for the bears.  The overall picture to me still looks moderately bearish aside from the strength that we are seeing in the Nasdaq.  Even though I think the rest of the market looks moderately bearish the strength in the Nasdaq is so impressive that they might pull everybody else higher. 

I want to talk a little bit about how I view the market in terms of the market leader.....I am always watching to see which market is the strongest in their direction or trend.  For example; during the sell off in August the Transports were the weakest market by far.  They were the weakest because they were first to make new lows of the year.  They were also the first ones to get wide separation from their major moving averages. The Transports were the strongest in their direction (lower) which told me that they were the leader to the downside. 

I think that we are now seeing the same thing happening with the Nasdaq only to the upside.  The Nasdaq looks like they are on a run to test the highs of  the year.  This would also mean that they would create separation from their major moving averages to the upside.  If this happens then I think that we will see all of the other major markets chase the Nasdaq  higher just like they chased the Transports lower.  

On to this week.......

We are just getting out of rollover and now heading into a two day FOMC meeting.  I hate to say it but technicals are not the most important thing in this market right now.  Although I believe that technicals are always the most important thing to focus on right now technical traders have to be small and nimble.  With a strong Nasdaq and weak everything else this market can do anything.  

For my big picture direction I will remain focused on the Nasdaq and how their trading according to their major moving averages.  Like I said; technicals are not the most important thing heading into this week the FOMC is.  But when the meeting is over then the technicals will become more relevant.  I want to see if the FOMC meeting collides with the bullish trend of the Nasdaq or goes with it.  Once the meeting is over I will be using the Nasdaq to help me identify the direction that this market is headed.  

With the Nasdaq being the leader to the upside I will be watching to see if their technical levels hold. Regardless if the news is bearish they should pull us up.  If they fail to hold then down we go.  If the Nasdaq can take a hit from bearish news and hold above their major moving averages then that will tell me how strong the Nasdaq really is.  If the Nasdaq fails to hold from bearish news then we know that they are not as strong as they appear to be.  If the news is bullish then we could see a big rally across the board.  (see charts)

Have a great week everybody and I look forward to seeing what happens.  

Moving Averages; Black (10 day), Blue (20 day)Green (50 day)Pink (200 day) Purple (150 day smooth avg.).  Horizontal Lines; Blue (High of the year)Red (Low of the year)Green (Unchanged for the year

E-mini Nasdaq

S&P Cash

Dow Industrials

Transports