Wednesday, June 29, 2011
Sunday, June 26, 2011
The week ahead 6/27 - 7/1
Last week was a wild ride for the market. The S&P cash tested and held their 200 day m.a. (for the 2nd time) and on that same day we had a positive rumor about the Greek bailout (or whatever you want to call it) soaring the market higher making it appear that to those who bought at or in front of the S&P's 200 day m.a. were going to look like geniuses (impressive how positive rumors come out at important technical levels). We had a 22.00 point rally off of the 200 day m.a. This rally also brought the NASDAQ futures back above their 200 day m.a. Giving us signs that we may have a possible short term bottom. With Dow Industrials and Transports remaining strong I thought that this could be the case, but after Fridays action I am not so sure. Traders were selling into the close making it appear that no one wanted to go home long into the weekend. All the major Indices closed near their lows of the day (bearish action).
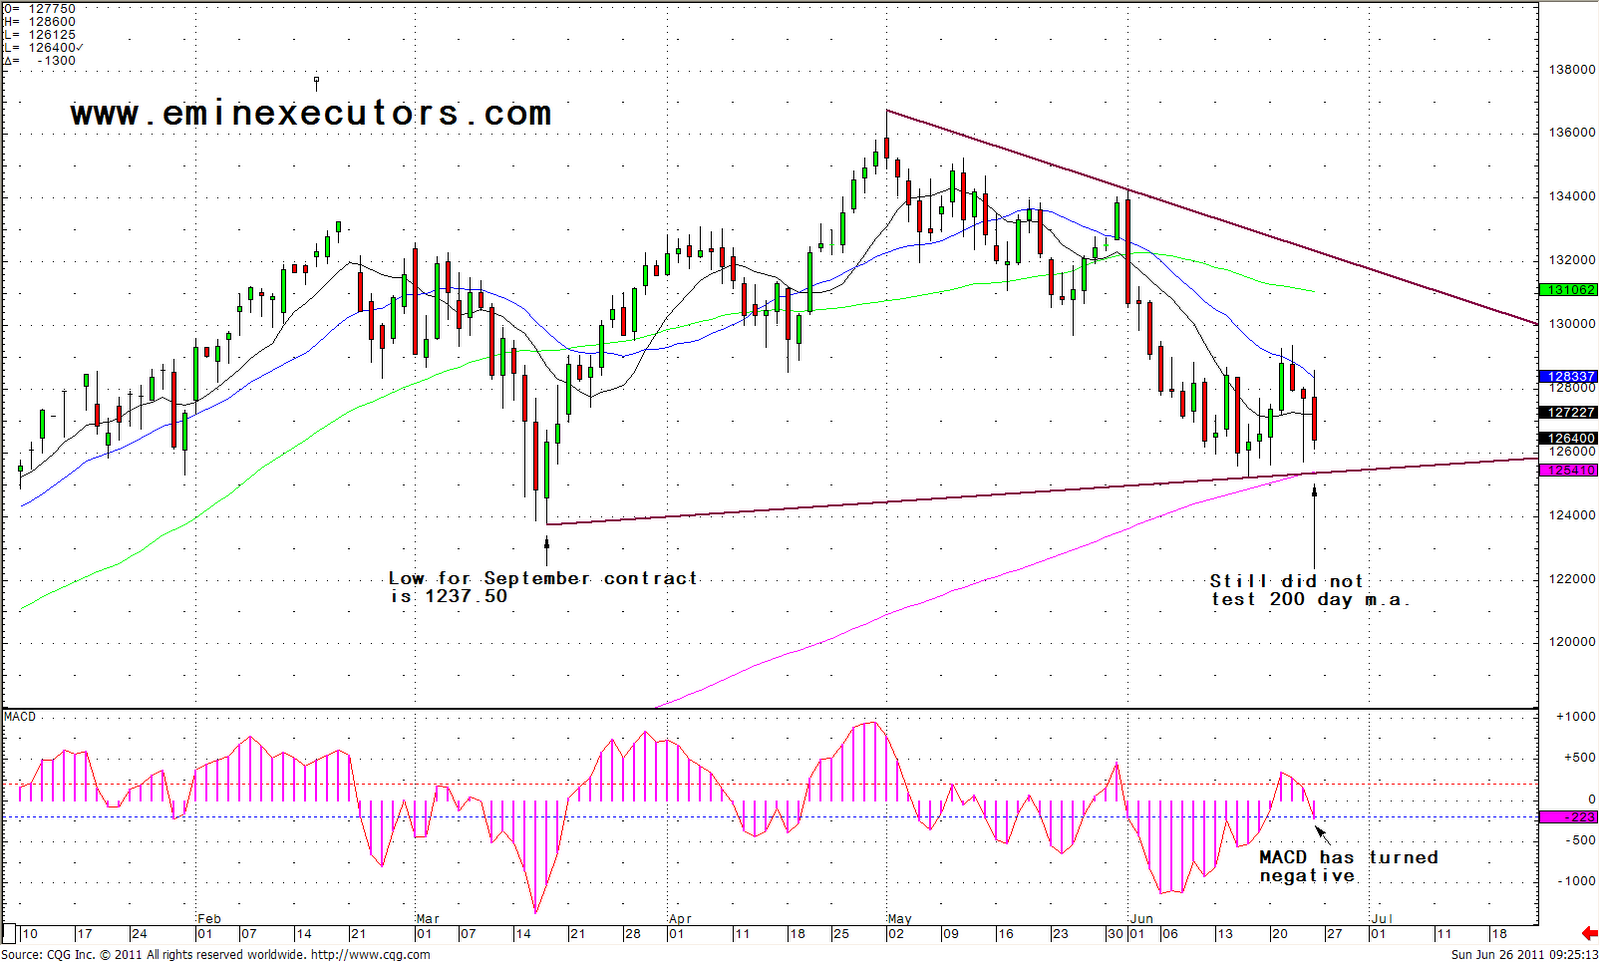
Going into this week I will be watching the overnight trade carefully to see if Friday was just traders closing out their longs before the weekend or if this is something else. I have been saying for awhile now that although the market has been trading weak for the past 2 months no major long term support has yet been broken in the S&P or Dow. I have been saying that our leader is the Dow and I am sticking with that. The Dow Industrials are currently 158 points away from testing their 200 day m.a. (11,776) and 379 points away from their low for the year (11,555). Until the Dow takes out its 200 day m.a. (11,776) and then makes a new low for the year I am not sure that the primary trend of the market has turned bearish. I believe in the Dow Theory for the primary trend of the market (this is not my only tool but an important one). So until the Dow Transports (4,906) and Industrials (11,555) start making new lows for the year at the same time I am not convinced that the primary trend of this market has turned bearish. Going into Monday I think the 200 day m.a. (1263.40) in the S&P will determine the direction for the week. If we can sustain trade above it then I think you will see a rally testing last weeks highs. If we cannot hold the 200 day m.a. in the S&P then I think you could see a sharp sell off in the markets and we will probably test the lows of the year in all of the major Indices. This is where the true test of this market will come. See charts below for more insight on the week ahead.
Going into this week I will be watching the overnight trade carefully to see if Friday was just traders closing out their longs before the weekend or if this is something else. I have been saying for awhile now that although the market has been trading weak for the past 2 months no major long term support has yet been broken in the S&P or Dow. I have been saying that our leader is the Dow and I am sticking with that. The Dow Industrials are currently 158 points away from testing their 200 day m.a. (11,776) and 379 points away from their low for the year (11,555). Until the Dow takes out its 200 day m.a. (11,776) and then makes a new low for the year I am not sure that the primary trend of the market has turned bearish. I believe in the Dow Theory for the primary trend of the market (this is not my only tool but an important one). So until the Dow Transports (4,906) and Industrials (11,555) start making new lows for the year at the same time I am not convinced that the primary trend of this market has turned bearish. Going into Monday I think the 200 day m.a. (1263.40) in the S&P will determine the direction for the week. If we can sustain trade above it then I think you will see a rally testing last weeks highs. If we cannot hold the 200 day m.a. in the S&P then I think you could see a sharp sell off in the markets and we will probably test the lows of the year in all of the major Indices. This is where the true test of this market will come. See charts below for more insight on the week ahead.
(200 day m.a., 50 day m.a., 20 day m.a., 10 day m.a., and unchanged for the year is green horizontal line.)
 |
| $ES_F |
 |
| SPX |
 |
| DJI |
 |
| DJT |
 |
| $NQ_F |
www.eminiexecutors.com 239-594-6876 info@eminiexecutors.com
Sunday, June 19, 2011
The week ahead 6/20 - 6/24
Last week the S&P cash tested and held its 200 day moving average, the Nasdaq 100 futures failed to hold their 200 day moving average and closed below it while the Nasdaq 100 cash closed on the low of the week right at its 200 day m.a., and the Dow Industrials are about 275 points away from testing their 200 day moving average. The question is...who is right? The Nasdaq is the weak one, the Dow Industrials are the strong one and the S&P is right in the middle. Who is the leader? The market always has a leader but the trick is identifying that leader. This recent sell off was led by the Nasdaq, but the rally over the past 2 years has been led by the Dow. So for right now I am sticking with the one that has been right for 2 years and not for 2 months and that is the Dow.
Until the Dow violates and closes below its 200 day moving average or has a Dow Theory confirmation reversing the primary trend to bearish, this recent sell off is nothing more than a correction.Although I am sticking with the Dow as the leader the bulls desperately need the Nasdaq 100 futures need to get back above their 200 day moving average or you could see the S&P cash dip back down to test its 200 day moving average which could shake out a lot of the longs and thus force the Dow to test theirs.
This week I believe that a lot of traders are looking for consolidation or an oversold bounce. My eyes will be on the Nasdaq to help me determine whether or not this bounce or consolidation will occur. If the Nasdaq can start the week off with a rally then you should see buyers coming in and taking the other markets higher across the board. If the Nasdaq cannot stay positive from last weeks close then you could will see a retest of the 200 day moving in the S&P cash and possibly a violation. This should then force a true test of the market and we will see if the Dow can hold its 200 day moving average or if we have a Dow Theory confirmation. This will be the deciding factor for the market to move forward in which ever direction that may be.
To read my day to day thoughts on the market please go to www.eminiexecutors.com and sign up for The Morning Brief.
 |
| SPX |
 |
| DJI |
 |
| DJT |
 |
| NQ_F |
 |
| NASDAQ 100 CASH |
 |
| VIX |
www.eminiexecutors.com 239-594-6876 info@eminiexecutors.com
Wednesday, June 15, 2011
Sunday, June 12, 2011
The week ahead 6/13 - 6/17
So far the S&P cash has had a 7.46% correction from the May high at 1370.58 to last weeks low at 1268.28. What to look for from here? To answer that question I go to the charts.
Although this may feel like the primary trend of the market has turned bearish we have not broken any long term support levels yet. I know that we are trading below the 50 day moving averages in all of the markets but that is not enough to say that the primary trend of the market has turned bearish. Right now my major focus will be watching the trend line (in all of the major markets) from the 2009 lows and their 200 day moving averages. I will also be looking out for a Dow Theory confirmation; it is when Dow Industrials and Transports take out their lows for the year at the same time (DJI 11,555 & DJT 4,906). This would turn the primary trend of the market bearish.
Currently the Dow Industrials remain the strongest market because they are farthest from their 2011 lows and also farthest from their trend line. The S&P is next followed by the Dow Transports and then the Nasdaq remains the weakest. The Nasdaq 100 cash market is in arms length of its 200 day m.a. while the other markets still have a little ways to go.
To start the week the most important chart is the Nasdaq. If the Nasdaq 100 cash can hold it's 200 day moving average (2,215.77) then I believe you will see a rally in the market. Also keep an eye on the Dow Transports. They are getting close to their trend line from 2009 lows (5,034) and their 200 day moving average (5,003). If either of these two markets takes out their 200 day moving average or trend line that would send a bearish message to the other markets, and we could see a sell off in the other markets looking to test their levels. If both the Nasdaq and Transports hold then I believe this will add confidence to the market and we will see a positive week.
Below are daily charts showing the trend lines from the 2009 lows and their 200 day moving averages (pink line).
www.eminiexecutors.com 877-470-2430 info@eminiexecutors.com
Although this may feel like the primary trend of the market has turned bearish we have not broken any long term support levels yet. I know that we are trading below the 50 day moving averages in all of the markets but that is not enough to say that the primary trend of the market has turned bearish. Right now my major focus will be watching the trend line (in all of the major markets) from the 2009 lows and their 200 day moving averages. I will also be looking out for a Dow Theory confirmation; it is when Dow Industrials and Transports take out their lows for the year at the same time (DJI 11,555 & DJT 4,906). This would turn the primary trend of the market bearish.
Currently the Dow Industrials remain the strongest market because they are farthest from their 2011 lows and also farthest from their trend line. The S&P is next followed by the Dow Transports and then the Nasdaq remains the weakest. The Nasdaq 100 cash market is in arms length of its 200 day m.a. while the other markets still have a little ways to go.
To start the week the most important chart is the Nasdaq. If the Nasdaq 100 cash can hold it's 200 day moving average (2,215.77) then I believe you will see a rally in the market. Also keep an eye on the Dow Transports. They are getting close to their trend line from 2009 lows (5,034) and their 200 day moving average (5,003). If either of these two markets takes out their 200 day moving average or trend line that would send a bearish message to the other markets, and we could see a sell off in the other markets looking to test their levels. If both the Nasdaq and Transports hold then I believe this will add confidence to the market and we will see a positive week.
Below are daily charts showing the trend lines from the 2009 lows and their 200 day moving averages (pink line).
 |
| $SPX |
 |
| $DJI |
 |
| $NDX |
 |
| $DJT |
 |
| $VIX |
www.eminiexecutors.com 877-470-2430 info@eminiexecutors.com
Wednesday, June 8, 2011
Video from June 8th Q&A
If you have any questions send an email or tag your tweet with #eminix
www.eminiexecutors.com 877-470-2430 info@eminiexecutors.com
Sunday, June 5, 2011
The week ahead 6/06 - 6/10
Recently I have been talking about the stars aligning for a correction. We have had three consecutive weeks of bad ecomnonmic data and all of the major indices are now failing to hold their 50 day moving averages. Some experts believe that 150 day (1287.28) and 200 (1248.04) day moving areas are the most important but you cannot ignore the fact that we cannot stay above the 50 day. Bad economic data and a breakdown of technicals usually equals a correction. The market has been so strong up to this point that it had to take both bad data and technicals to take this market lower. A 5% corrrection in the S&P was 1302.05 and now eyes are on a 10% correction that would be 1233.52. Will that happen? At this point I don't see why not. Here are some factors why this could happen; through March the S&P had a high of 1344.07 and then made a low of 1249.05. From that low on March 16th we rallied to new highs on May 1st (1370.58). We made a new high by 26.51. My theory is if we can do it on the upside then it could happen on the downside. A lot of times the market will make a new high or low by the same amount that it did in the other direction. That would mean if we continue to stay weak and make a new low, the new low could be made by 26.51 points which would put the S&P at 1222.54 just below a 10% correction at 1233.52.
Looking ahead to this week. The past few weeks we have had different leaders in the market. The Dow Industrials and Dow Transports were by far the strongest while the Nasdaq was the weakest, leaving the S&P in the middle. That has now changed; the Dow Industrials took out their May low and had a near double bottom from April. The Dow Transports also took out the May low but came up short of the April low. The Nasdaq has not yet taken out its April low, leaving it the least weak market. The S&P is the most important market and and they are almost as weak as the Dow markets because they have also taken out their May low. Going into Monday the selling pressure will accelerate if the Nasdaq takes out their May low (2250.25) and if the VIX takes out its April high (20.03). If they both hold these areas then I will be less aggressive with my selling and could possibly be a small buyer. I will be looking at my S&P charts along with the other markets for confirmation to either side. We are in the middle of rollover so expect to see some violent moves up and down.
www.eminiexecutors.com 877-470-2430 info@eminiexecutors.com
Looking ahead to this week. The past few weeks we have had different leaders in the market. The Dow Industrials and Dow Transports were by far the strongest while the Nasdaq was the weakest, leaving the S&P in the middle. That has now changed; the Dow Industrials took out their May low and had a near double bottom from April. The Dow Transports also took out the May low but came up short of the April low. The Nasdaq has not yet taken out its April low, leaving it the least weak market. The S&P is the most important market and and they are almost as weak as the Dow markets because they have also taken out their May low. Going into Monday the selling pressure will accelerate if the Nasdaq takes out their May low (2250.25) and if the VIX takes out its April high (20.03). If they both hold these areas then I will be less aggressive with my selling and could possibly be a small buyer. I will be looking at my S&P charts along with the other markets for confirmation to either side. We are in the middle of rollover so expect to see some violent moves up and down.
 |
| ES_F |
 |
| SPX |
 |
| DJI |
 |
| DJT |
 |
| NQ_F |
 |
| VIX |
www.eminiexecutors.com 877-470-2430 info@eminiexecutors.com
Wednesday, June 1, 2011
Subscribe to:
Posts (Atom)