Clicky

E-mini Executors: November 2011

Sunday, November 27, 2011

The market has been unraveling...


The market has been unraveling.  Ever since the S&P crossed back below their 150 day smooth moving average the market has been in a downward spiral.  The bears are back in control of this trade.  The S&P, Dow, Nasdaq, and Transports are all trading below their major moving averages and in negative territory for the year.  All of the Indices are also trading in the middle of this summers’ range which puts the bottom of that range in play (the lows of the year).  As long as the markets remain in this summer’s range I think that the lows of the year are in play.  

I talk about this all of the time; when the news and the technicals collide we have a battle….when the news and the technicals coincide we have the biggest moves.  Europe has obviously weighed on the U.S. markets.  Where the U.S. markets are priced right now “technically” gives the bears complete control of this trade.   Right now the market tells me that we could be in store for a big move lower due to the negative headlines and the breakdown in technicals.  If the news starts to get better and we see a rally; the key will be if we can crossover the major moving averages and sustain trade above them.  In the past six months we have not seen that happen and until it does I think that all of the rallies will be met by big sellers.

This week will be a very interesting week for the market.  If the market rallies then I think that we could see some bulls step in and try to give the market a little push higher possibly trying to retest some major moving averages (which I think will be met with strong sellers).  If we continue to selloff then I think that we could see some panic selling come in and we may have another bad week for stocks.  The bears have all of the momentum with the headlines and technicals going their way.  That means I will be more aggressive selling rallies (barring any good news from Europe) and very nimble when buying breaks.  Have a great week!


Moving Averages; Black (10 day), Blue (20 day)Green (50 day)Pink (200 day) Purple (150 day smooth avg.).  Horizontal Lines; Blue (High of the year)Red (Low of the year)Green (Unchanged for the year, Black (last summers range), Light Blue (Old highs that could be tested)

$SPX

$ES_F


$SPY

$DJIA

$DJT

$NQ_F

$VIX

Market Profile single ticks


Market Profile daily single ticks

Market Profile daily single ticks

Market Profile daily single ticks


Sunday, November 20, 2011

The bears continue to battle with the bulls.

The bears continue to battle with the bulls.  Last week was a good week for the bears.  The headlines about Europe continue to pressure the longs and we are now starting to see technical damage being done.  Up until last week the bulls were looking pretty good despite the negative headlines.  Now we are seeing the technicals start to break down and they could soon be looking to favor the bears.

The Nasdaq 100 futures which had been trading above their 200 day and 50 day moving average for over a month.  They now have had two consecutive days with closes below both moving averages (bearish action).  The Nasdaq has been the leader to the upside and when the leader starts to have bearish action that is not good for the rest of the market.  As long as the Nasdaq remains below their 200 day and 50 day moving averages I think that we will continue to see selling pressure on the market.

The Dow has been chopping around its 200 day moving average for weeks and as of right now they are trading below it.  The Dow still remains above the rest of their major moving averages and is still in positive territory for the year (11,577).  If the Dow cannot get back above their 200 day moving average within the next day or so I think that the market will take that as a negative and we could see the Dow slip lower looking to retest some of their major moving averages and unchanged for the year.

The S&P (cash, futures, SPY) are now trading in between their 150 day smooth moving average and their 50 day moving average.  With the momentum now being to the downside; they need to get back above their 150 day smooth moving averages sooner than later or I think that the 50 day moving averages will be tested.  If the 50 day moving averages are broken then I think that the market will see a sharp selloff.  If they can hold their 50 day moving averages then I think that we could see the market firm up and work its way higher.

The Transports have been the weakest market over the past several months and on this recent break there was no real technical damage done.  Last week they tested and held their150 day smooth moving average. If the Transports can sustain trade above their 150 day smooth moving average then we may see equities start to work their way back up.  If they cannot hold their 150 day smooth moving average then I think that we could see the market continue to selloff.

With all that is going on with Europe I will be watching the technicals extremely close.  When the headlines and the technicals collide we see a battle, but when they start to work together we see the biggest moves.  

CHARTS
Moving Averages; Black (10 day), Blue (20 day)Green (50 day)Pink (200 day) Purple (150 day smooth avg.).  Horizontal Lines; Blue (High of the year)Red (Low of the year)Green (Unchanged for the year, Black (last summers range), Light Blue (Old highs that could be tested)


$SPX


$SPY

$DJIA


$NQ_F

$VIX


Sunday, November 13, 2011

Thoughts on the current market and the week ahead... 11/14 - 11/18

Last week's battle was won by the bulls but the war has yet to be determined.  The headlines remain in favor of the bears but the technicals are in favor of the bulls.  That is what is creating this war.  At some point in the near future I think that we could see a sharp move in one direction.  As of right now I am thinking that move will be higher.  For all of the bad news that we have seen in the past month(s) the market is not in bad shape.   

The Nasdaq (100 futures) remain the strongest market by sustaining trade above their 200 day moving average and at the top part of their yearly range.  If the Nasdaq can get above their weekly high at 2408.75 I think that they will make new highs of the year rather quickly (2435.50).  

The Dow is also remaining strong.  On Friday the Dow closed back above their 200 day moving average and they are now about 720 points away from their high of the year.  

This week the S&P (futures, cash, SPY) all held an important test of their 150 day smooth moving average. They all basically had a double bottom at their 150 day smooth moving averages and now are comfortably above it.  Although that is bullish action I am still not convinced the bulls are in control of the S&P.  The S&P (futures, cash, SPY) are all in positive territory for the year (just barely) and they all look like they want to test their 200 day moving averages and daily down trends.  If they can close above their 200 day moving averages and daily down trends then I thinks that the bulls will have control.  

The Transports are still the weak link in the chain but they are showing signs of strength.  They too (like the S&P) held a test of their 150 day smooth moving average and as of right now they are at their daily down trend and 200 day moving average.  If they can close above that area the only thing left for them to accomplish would be getting back into positive territory for the year.  If that happens then I think that bulls will have complete control over the market and we could see a nice rally.  

If the headlines about Europe's debt crisis can turn positive (not sure if that is possible) I think that the market could be set up for a nice year end rally.  If the headlines get worse I will be watching to see if the technicals break down for the bulls.  If that happens then I think that we could sell off into the end of the year.  If nothing happens and its the same old headlines, then I think that we go higher.

CHARTS
Moving Averages; Black (10 day), Blue (20 day)Green (50 day)Pink (200 day) Purple (150 day smooth avg.).  Horizontal Lines; Blue (High of the year)Red (Low of the year)Green (Unchanged for the year, Black (last summers range), Light Blue (Old highs that could be tested)

$DJIA

$SPX

$DJT

$NQ_F

$VIX

$SPY

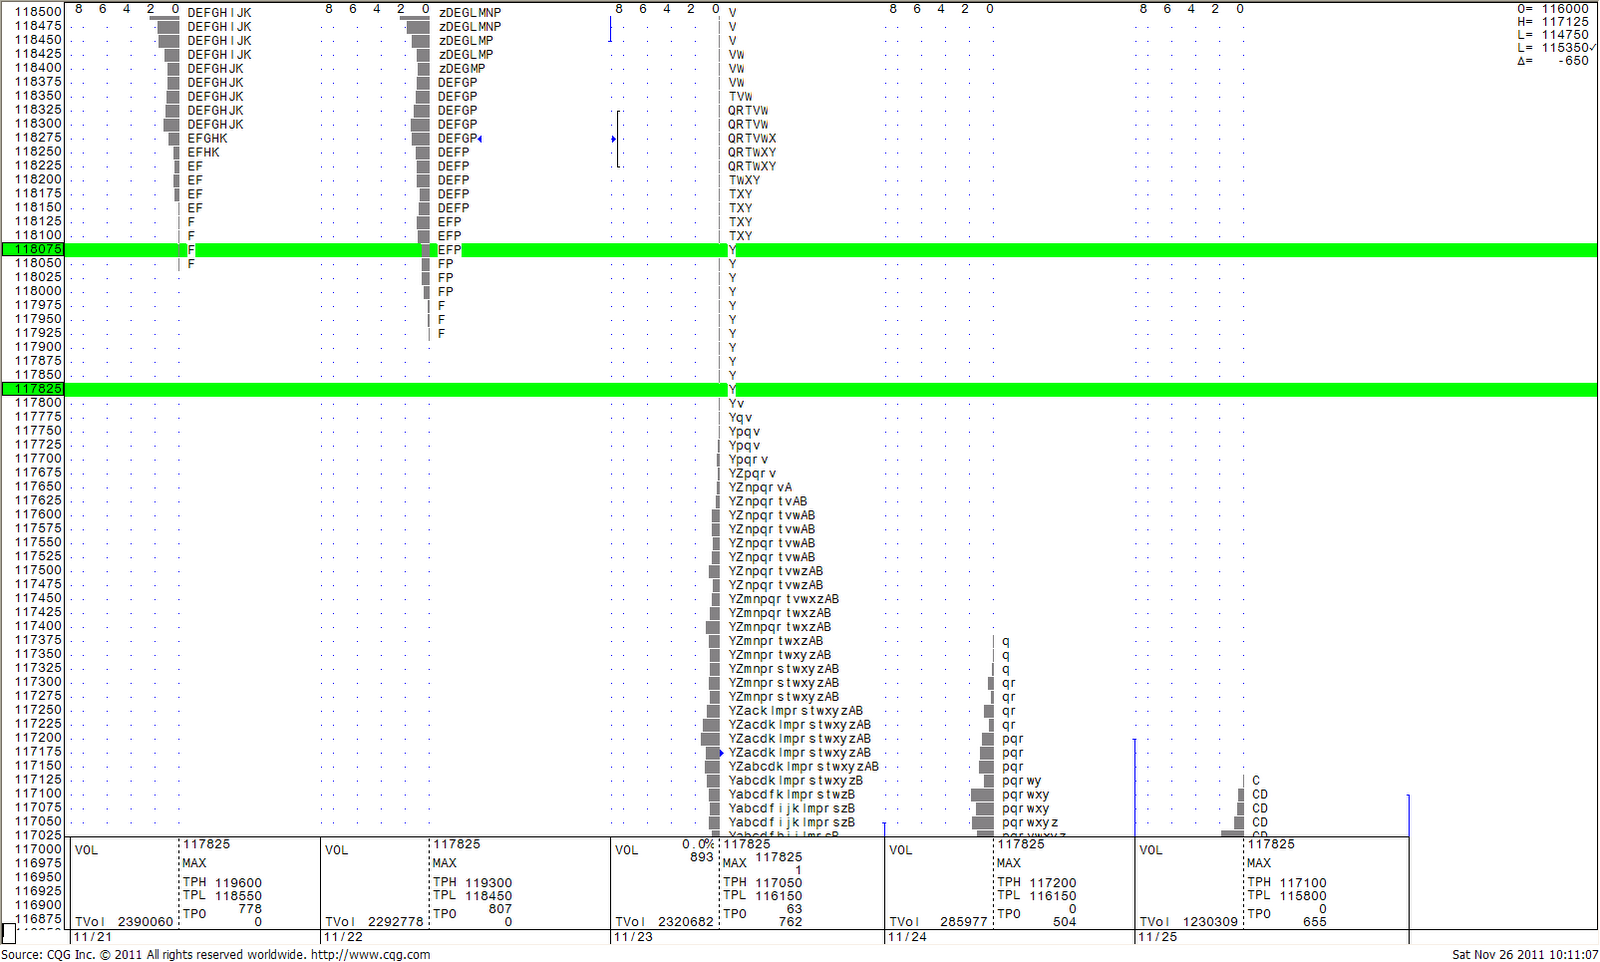
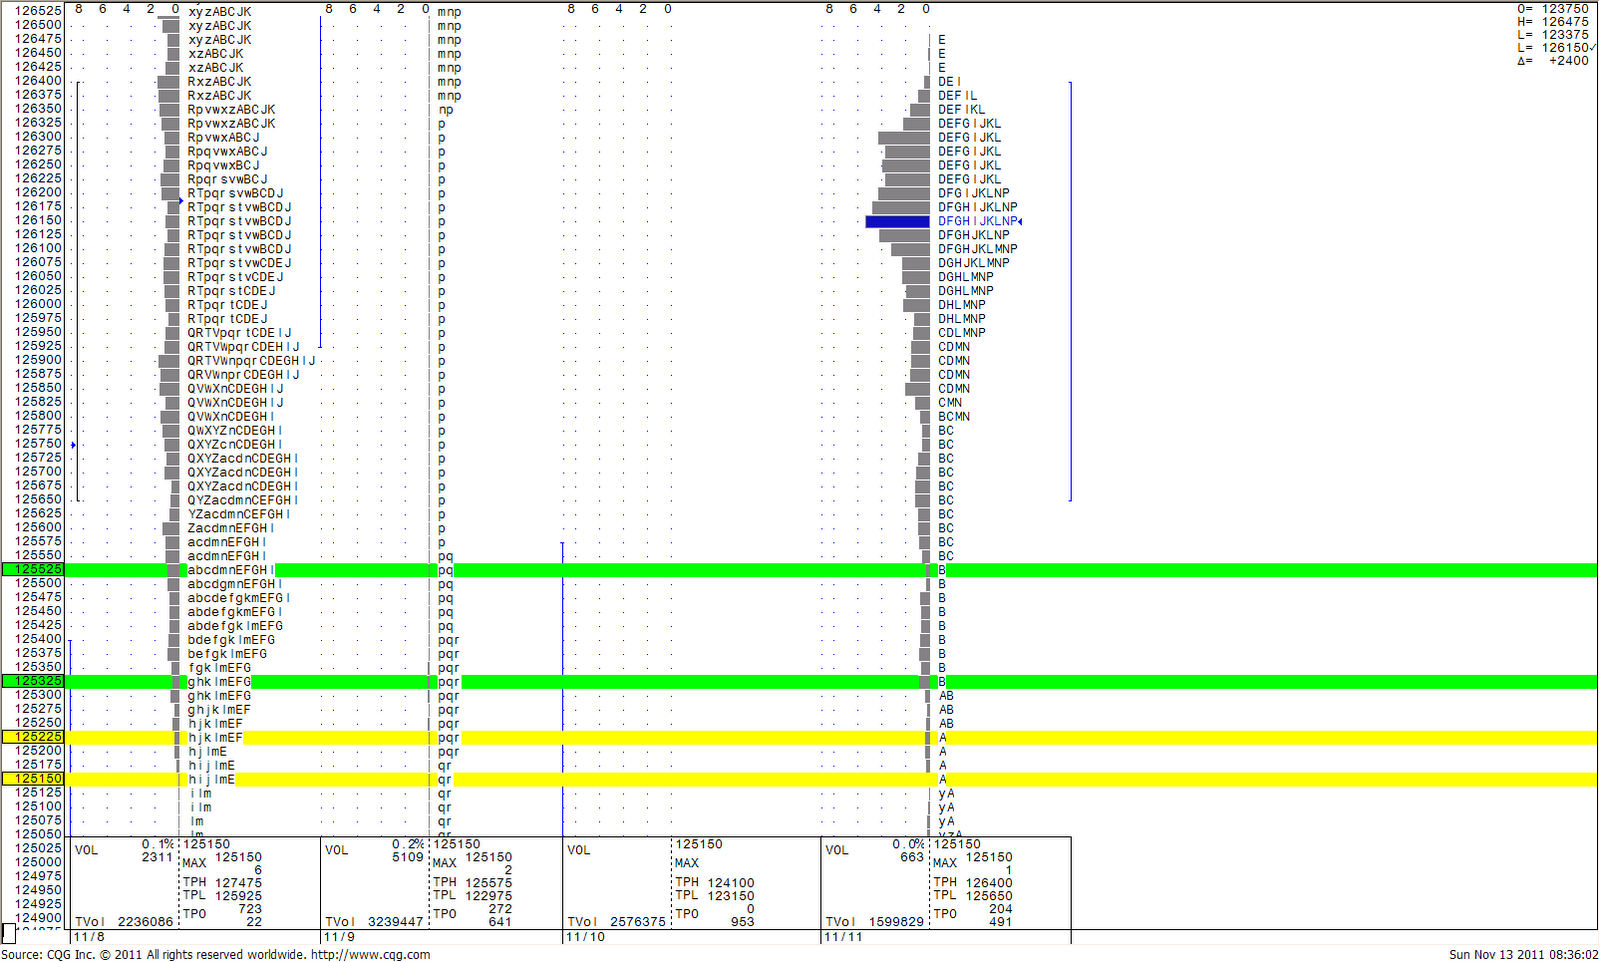
Market Profile single ticks from Friday's trade.  $ES_F


Sunday, November 6, 2011

November Newsletter

November Newsletter 2011